Training gets the spectacular hardware headlines. Inference is where models get called again and again after they reach production. DeepInfra says that recurring workload has pushed its annualized run rate above $105 million while the platform serves about 22 trillion tokens each week.1
DeepInfra says its annualized run rate exceeds $105 million and its platform serves about 22 trillion tokens per week. Those company-reported figures suggest meaningful production inference volume, but annualized run rate is not audited annual revenue and token throughput does not reveal gross margin, model mix or customer concentration.1, 2
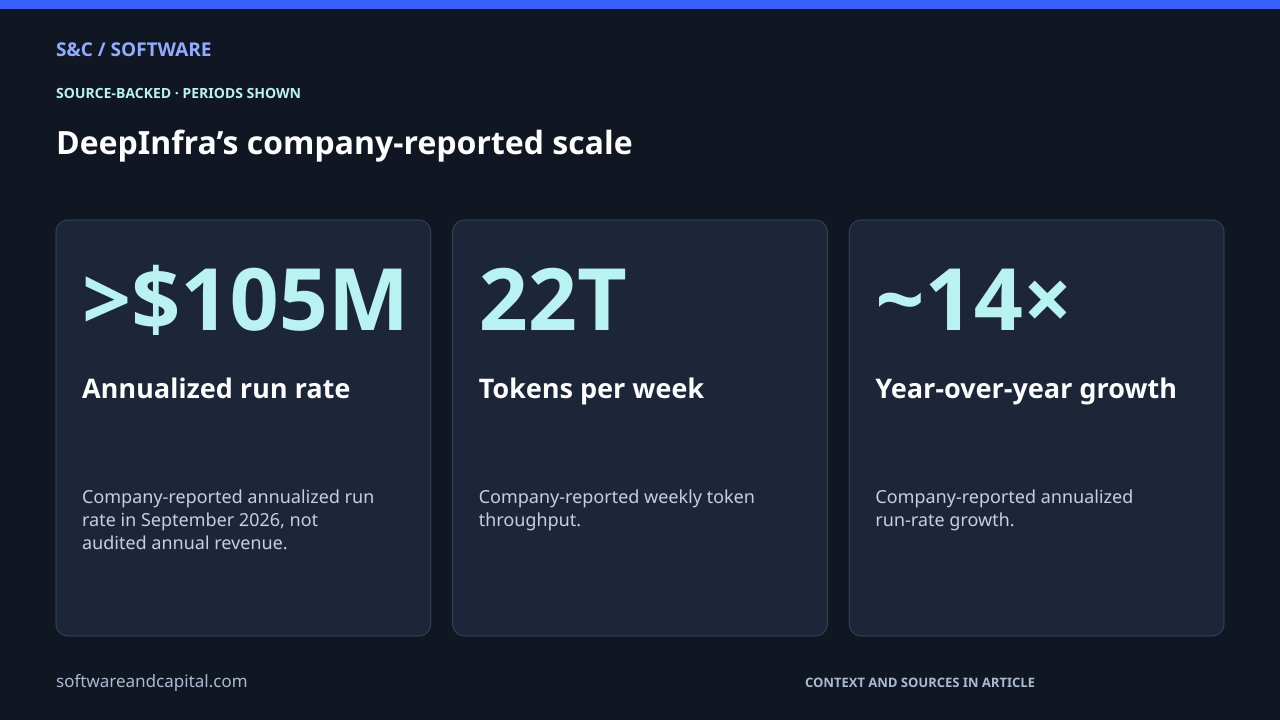
DeepInfra’s company-reported scale
Inference is becoming a standalone cloud layer
A model lab can sell its own API and a hyperscaler can bundle inference into a broad cloud. DeepInfra’s business is the middle layer: aggregate many models and serve them through infrastructure optimized around inference demand.1
| Metric | What it tells us | What it does not |
|---|---|---|
| Annualized run rate | Current revenue pace extrapolated over a year | Audited annual revenue, profit or retention |
| Tokens per week | Amount of model input/output processed | Revenue per token, model mix or gross margin |
Twenty-two trillion tokens can hide very different economics
A token served on an expensive frontier model is not economically equivalent to a token on a small open model. Input and output prices also differ, as do hardware utilization and customer discounts. Throughput therefore signals scale without revealing unit economics.
Utilization is the infrastructure question underneath the revenue
Inference providers pay for accelerators whether every second of capacity is perfectly utilized or not. Routing many customers and models through a shared fleet can improve utilization, but the cited disclosures do not reveal DeepInfra’s hardware costs or margins.1
What would make the business easier to judge
- Gross margin by model or workload category.
- Customer concentration and net revenue retention.
- Committed versus on-demand infrastructure capacity.
- Revenue mix between high-cost frontier models and smaller open models.
The $105 million run-rate figure is the attention grabber. The more durable story is that inference volume can support a specialized infrastructure company between model creators and end applications.
Sources and methodology
Sources checked September 29, 2026. Dates and periods for individual figures are stated beside them.
- TMCnet: DeepInfra surpasses $100M ARR ↗Accessed 2026-09-29
- DeepInfra documentation ↗Accessed 2026-09-29
Scope and assumptions
Run rate, growth and token-volume figures are company-reported and are not audited annual revenue.
The cited disclosures do not provide gross margin, customer concentration or model-level economics.
Continue reading
GPT-6.1 Sol Costs One-Fifth as Much as Astra. Agent Loops Make That Matter →