Apple still looks like a hardware company from the outside: iPhones, Macs, iPads and wearables dominate the physical experience. The June 2026 quarter shows why the financial story is more balanced. Services supplied only about 28% of sales, but roughly 42% of gross profit.1
In Apple’s June 2026 quarter, Services generated $30.739 billion of $109.417 billion in sales, about 28.1%. Because Services cost of sales was much lower relative to revenue than Products, Services produced about $23.245 billion of gross profit—roughly 42.4% of Apple’s total gross profit. Gross profit is not operating profit.1, 2
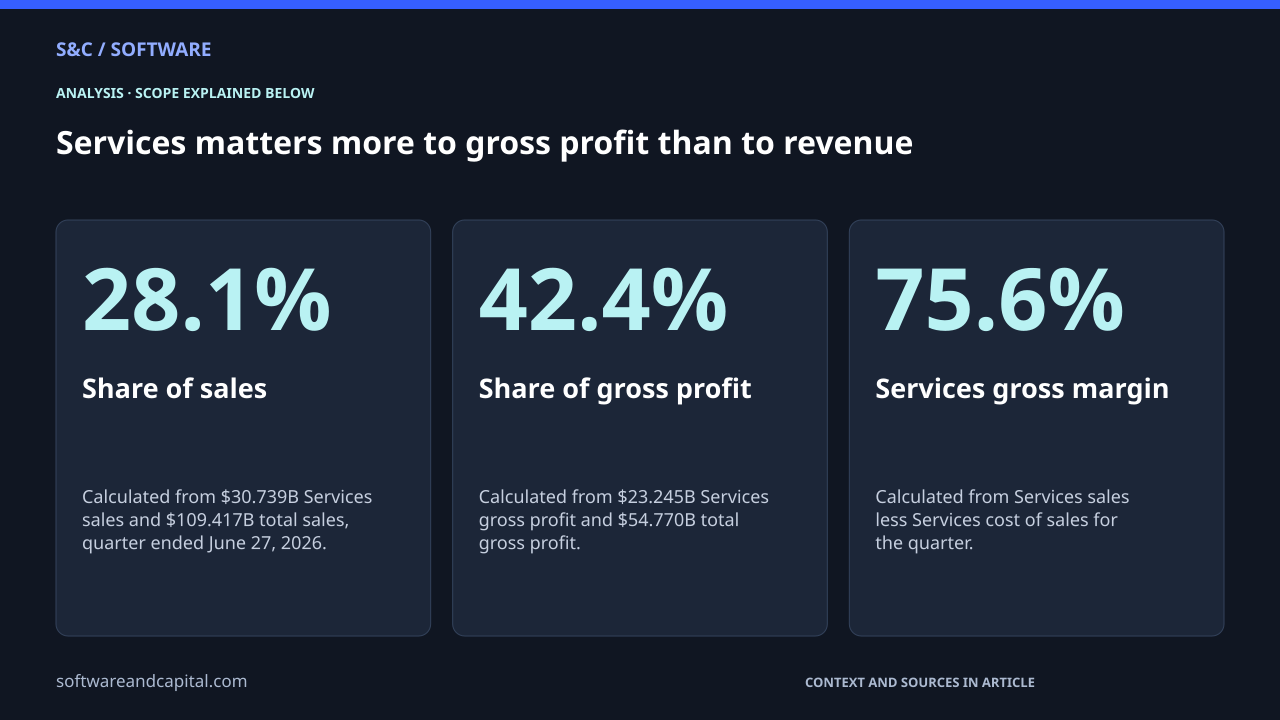
Services matters more to gross profit than to revenue
Calculated from $30.739B Services sales and $109.417B total sales, quarter ended June 27, 2026.
Calculated from $23.245B Services gross profit and $54.770B total gross profit.
Calculated from Services sales less Services cost of sales for the quarter.
That does not mean Services is a separate company with a 75.6% operating margin. Apple reports product and services cost of sales separately, which lets us calculate gross profit. Research, sales, administration and other operating costs are reported at the company level rather than assigned here.1
The margin gap is the reason the mix matters
| Category | Net sales | Cost of sales | Calculated gross profit |
|---|---|---|---|
| Products | $78.678B | $47.153B | $31.525B |
| Services | $30.739B | $7.494B | $23.245B |
| Total | $109.417B | $54.647B | $54.770B |
Products generated far more revenue, but they also carried much more cost of sales. Every $100 of Services revenue in this quarter left roughly $75.60 of gross profit before shared operating expenses. Every $100 of Products revenue left roughly $40.10. That difference makes the revenue mix economically important.1
What sits inside Services
Apple’s filing describes Services as including advertising, AppleCare, cloud services, digital content and payment services. The company’s results announcement also highlighted a June-quarter record for Services revenue. The category therefore mixes several businesses rather than representing one subscription product.1, 2
That is why multiplying one subscription price by an installed-base estimate would not reconstruct the segment. Some services charge consumers directly, some earn fees around transactions or distribution, and some are tied to devices. The financial line is broader than any one product people recognize.
Services can grow without replacing hardware
The useful way to read the mix is not “Services versus iPhone.” Hardware expands the installed base on which many services can be used, while services can make that installed base more valuable over time. The businesses can reinforce one another even when their margins and growth rates differ.
That relationship resembles the lesson in Shopify’s revenue mix: the largest revenue stream is not automatically the one contributing the same share of gross profit. Revenue tells you scale. Gross profit begins to show the economics underneath it.
One quarter also needs one important footnote
Apple said company gross margin in the quarter included a favorable impact of about two percentage points from tariff refunds. The filing does not assign that benefit between Products and Services in the table used here. The calculated category gross profits are faithful to the reported cost-of-sales lines, but the quarter should not be treated as a timeless margin template.2, 1
Three numbers to keep separate
- Revenue share: how much of Apple’s sales came from Services.
- Gross-profit share: how much remained after category cost of sales.
- Operating profit: what remains only after broader company operating expenses are considered.
Apple’s hardware still generated most of the quarter’s revenue. Services matters because a smaller slice of sales produced a much larger slice of gross profit. That is a different claim—and a more useful one—than simply saying Apple is becoming a services company.
Sources and methodology
Sources checked September 22, 2026. Dates and periods for individual figures are stated beside them.
- Apple: Q3 FY2026 Form 10-Q ↗Accessed 2026-09-22
- Apple: Third-quarter fiscal 2026 results ↗Accessed 2026-09-22
Scope and assumptions
The calculation uses Apple’s quarter ended June 27, 2026 and should not be treated as a permanent margin mix.
Apple noted a tariff-refund benefit in company gross margin, but the cited table does not allocate that benefit between Products and Services.
AI-assisted research and editing. Our editorial standards.
Continue reading
76% of Shopify’s Revenue Came from Merchant Solutions in 2025 →