Waymo’s latest safety headline is unusually large: more than 270 million fully autonomous miles and substantially fewer injury crashes than human benchmarks. The percentages are useful, but only after asking what was compared with what.1
Waymo says its latest analysis covers more than 270 million fully autonomous miles through June 2026 across Atlanta, Austin, Los Angeles, Phoenix and San Francisco. It reports 82% fewer injury-causing crashes and 95% fewer serious-injury-or-worse crashes than human benchmarks, regardless of fault. Those percentages come from Waymo’s analysis and depend on matching autonomous exposure with appropriate human-driving benchmarks.1, 2, 3
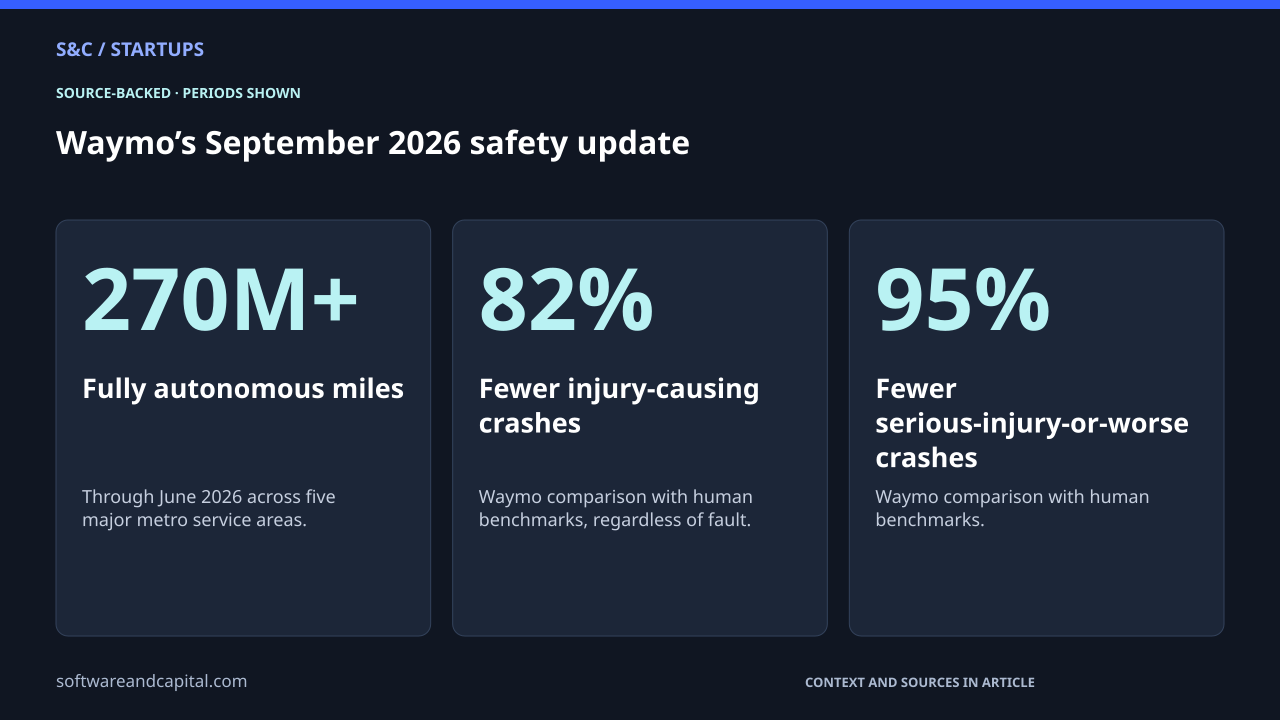
Waymo’s September 2026 safety update
Start with the exposure, not the percentage
The analysis covers Atlanta, Austin, Los Angeles, Phoenix and San Francisco. That is a large operational sample, but it is not every road, weather condition or city. A safety rate describes performance inside the exposure that produced it.1
The human benchmark is part of the result
Waymo has repeatedly argued that autonomous miles should be compared with human driving in similar places and conditions. Its own research notes that time and location change crash risk, which is why blanket national averages can make an apples-to-apples comparison difficult.2
Waymo also uses behavioral reference models such as ReD to study crash avoidance. These models answer a different question from observed crash rates: how a careful human reference driver might respond to a conflict.3
Regardless of fault is a deliberate choice
Waymo reports the crash comparisons regardless of who caused the collision. That avoids making the safety result depend on post-crash fault assignment, but it also means the measure is involvement in a crash rather than a count of crashes caused by the autonomous system.1
841 fewer crashes is an estimate, not a hidden crash counter
Waymo says the 270 million miles correspond to an estimated 841 fewer injury-causing crashes than the human benchmark would predict. The word estimated matters: it is the difference between observed Waymo outcomes and a benchmarked human expectation for comparable exposure.1
This is a different question from why Waymo needed a $16 billion financing round. Capital tells us what scaling costs. Safety evidence asks whether the service is meeting one of the central reasons for automating the driver.
Five questions for any robotaxi safety headline
- How many autonomous miles or trips are included?
- Which cities, roads and operating conditions produced those miles?
- What human benchmark is being used and how is exposure matched?
- Does the metric count all crash involvement, fault-assigned crashes or a narrower severity category?
- Is the headline an observed count, a rate comparison or an estimated number of crashes avoided?
Waymo’s dataset is now large enough to make direct crash-rate comparisons increasingly informative. That does not remove the need to read the denominator and benchmark. In autonomous-driving safety, the methodology is part of the headline.
Sources and methodology
Sources checked September 25, 2026. Dates and periods for individual figures are stated beside them.
- Waymo: 270 million autonomous mile safety update ↗Accessed 2026-09-25
- Waymo: time and location in safety benchmarking ↗Accessed 2026-09-25
- Waymo: Reference Driver model ↗Accessed 2026-09-25
Scope and assumptions
The headline results come from Waymo’s own analysis in selected operational domains.
Estimated avoided crashes depend on the human benchmark and exposure-matching methodology.
Continue reading
$16B for Driverless Rides: Why Robotaxis Need So Much Capital →