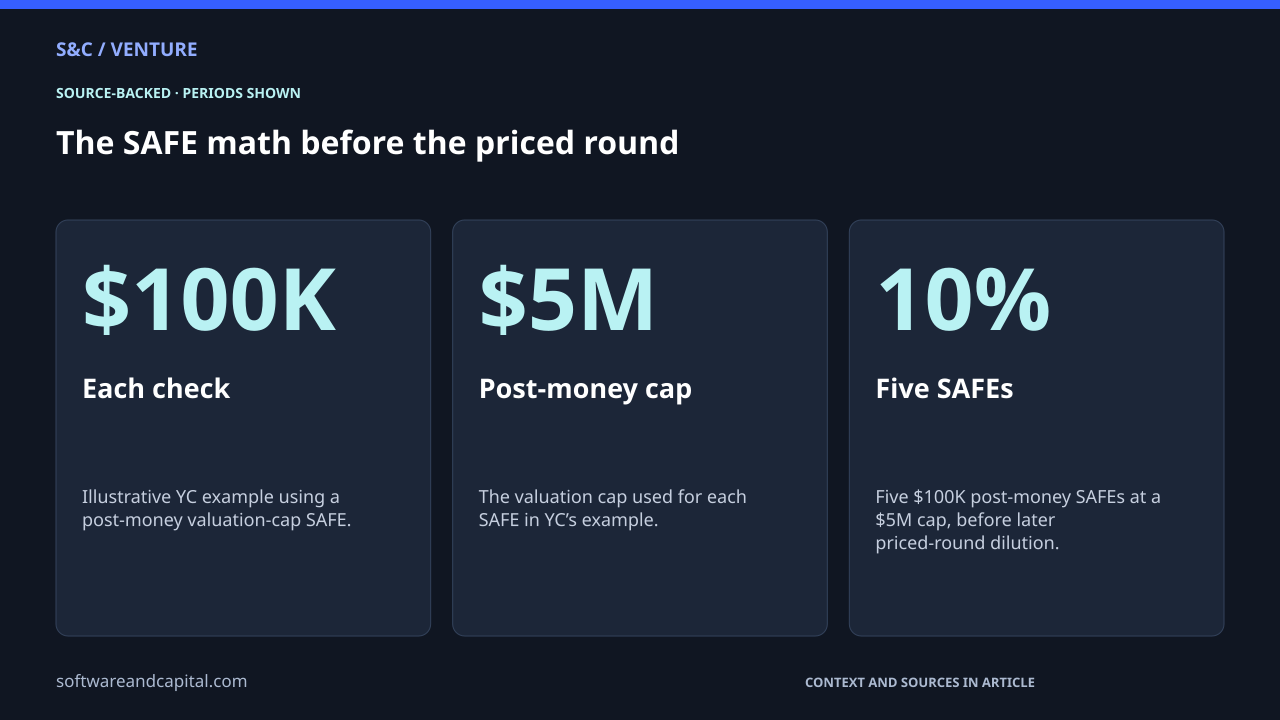
A $100,000 SAFE at a $5 million post-money valuation cap can look like a small financing. In Y Combinator’s math, it represents 2% ownership. Sign five of those SAFEs at the same cap and the company has sold 10%. The checks are small individually, but the ownership adds.1, 3
For YC’s post-money valuation-cap SAFE, ownership sold equals investment divided by the post-money cap. Five $100,000 SAFEs at a $5 million cap therefore add up to 10%, not 2%. The SAFE holders can then be diluted by the new money and a new or increased option pool when the company raises a priced round.1, 2
The SAFE math before the priced round
| SAFEs signed | Total invested | Ownership represented |
|---|---|---|
| 1 × $100K | $100K | 2% |
| 2 × $100K | $200K | 4% |
| 3 × $100K | $300K | 6% |
| 5 × $100K | $500K | 10% |
The valuation cap turns dollars into an ownership percentage
For a YC post-money valuation-cap SAFE, the basic ownership calculation is investment divided by the post-money valuation cap. A $100,000 investment divided by $5 million is 2%. YC designed the post-money form so founders and investors can calculate that ownership before a later equity financing converts the SAFE into shares.2
That transparency is the important part. A founder does not need to wait for a Series A to discover that five separate 2% promises add up to 10%. The cap table can track the running total while each SAFE is still a convertible instrument rather than issued stock.2, 1
Post-money SAFEs are additive, not mutually dilutive
YC says post-money SAFEs at valuation caps are additive because the other SAFEs are already included in the company-capitalization denominator. One SAFE does not reduce the percentage represented by another. This is why the five-check example lands at 10% rather than leaving every investor with only a slice of the original 2%.1
The priced round adds another layer of dilution
The fixed SAFE percentage is not the founder’s final post-round cap table. YC’s calculator explains that new money in the priced round and a new or increased option pool dilute both founders and post-money SAFE holders. Those two items sit outside the SAFE’s earlier capitalization calculation and enter when the priced round is modeled.1
| Stage | What the founder can know | What can still change |
|---|---|---|
| Post-money capped SAFE | Ownership represented by each capped SAFE using investment ÷ cap | Discount or MFN instruments use different mechanics |
| Additional capped SAFEs | Their ownership percentages can be added to the running total | New SAFEs add more ownership sold |
| Priced equity round | SAFE conversion happens automatically under the instrument terms | New-money financing and an increased option pool can dilute existing holders |
A SAFE is not stock until it converts
YC describes a SAFE as an instrument that converts into preferred stock when the company raises a priced equity financing. That distinction matters when reading a cap table. The SAFE represents an ownership claim under its terms before the holder becomes a stockholder, which is why modeling the conversion is part of understanding the next round.2, 1
Before signing the next SAFE, keep these numbers together1, 2
- The amount of every outstanding post-money valuation-cap SAFE.
- The valuation cap attached to each SAFE rather than only the latest one.
- The cumulative ownership represented by all capped SAFEs issued so far.
- The option-pool increase and new-money amount expected in the next priced round.
This is why a cap table becomes more than a list of names. The cap-table software pricing analysis shows how vendors expand from a free ownership record into modeling, valuation and reporting work. The arithmetic becomes valuable before the company is large because every new financing term changes the ownership story.
The 10% example is not a universal startup outcome. It applies to five $100,000 post-money valuation-cap SAFEs at a $5 million cap. Different SAFE forms, discounts, MFN terms, priced-round valuations and option-pool negotiations can produce different results. The useful habit is simpler: keep a running ownership calculation before another check gets signed.1, 2
Sources and methodology
Sources checked September 27, 2026. Dates and periods for individual figures are stated beside them.
- Y Combinator: SAFE conversion calculator ↗Accessed 2026-09-27
- Y Combinator: the SAFE and how post-money ownership works ↗Accessed 2026-09-27
- Y Combinator: SAFE vs. convertible note vs. priced round ↗Accessed 2026-09-27
Scope and assumptions
The 10% result applies to the stated YC post-money valuation-cap SAFE example and is not a prediction for every SAFE financing.
Discount SAFEs, MFN SAFEs, pre-money instruments and negotiated priced-round terms can follow different mechanics.
This is an educational explanation of published instrument mechanics, not legal, tax or personalized fundraising advice.
Continue reading
Why Cap-Table Software Is Free Until Your Startup Gets Complicated →